I took the Data Analysis course, by Jeff Leek, on Coursera some time ago.
The course covers how to do data analysis. The useful parts if you are not a data analyst or planning on becoming one, is that you learn some statistics, how to explore data and see correlations, and also how to use R, which is an interesting language for statistics. It is also fairly easy to use for graphs, and you can achieve quite a lot with very little code.
The course is mostly in video, and you have a weekly quizzes as well as 2 data analyses that you have to make.
It took me about 23 hours to complete the course, including quizzes and data analyses.
Overall I found the course to be good, although I found some of the later quizzes to be a little hard. I think it could have used more practical exercises and quizzes, and some of the later classes could be more clear.
Recommended if you are interested in the area.
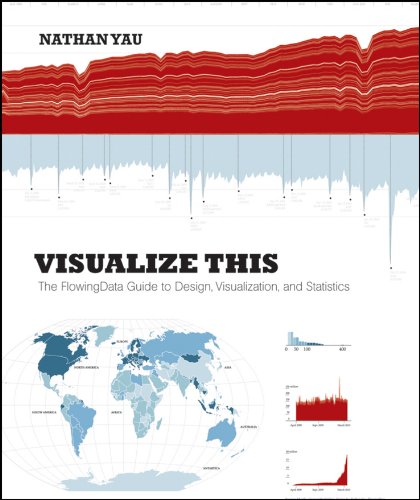
Don't have a lot of time? Some of what is covered here is also in Visualize This – and even if you end up taking the course, you will probably be able to use some of what you learned in the book.


