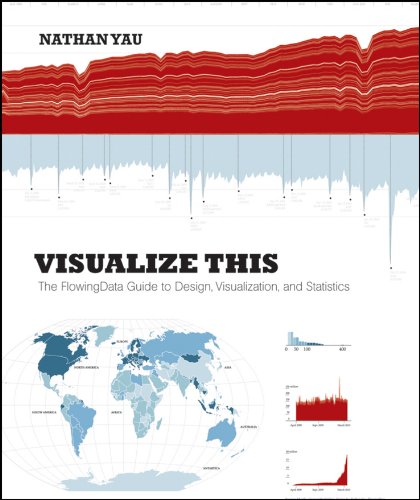
Visualize This: The FlowingData Guide to Design, Visualization, and Statistics – by Nathan Yau, covers data visualization, including how to get, parse and visualize the data.
There is plenty of code in several languagues (R, Python and JS mostly, with some Flash), and there are plenty of great looking results which really tell the story well.
If you are interested in Data Visualization in general or just need to make some maps with points in it, this is a great book.


