I have just released version 4.02 of STG FolderPrint Plus.
Changes:
– Natural Sort – sorts files as 1,2,3,4,11 vs 1,11,2,3,4. User request on our recent survey.
– Scaled forms – if you use the standard Windows font size, you shouldn't notice any difference. However, if you use Large font size or larger, the program will try to scale most forms for the new font size. Personally, I use large fonts and I think it looks a lot better now! If you have any problems, please contact me.
– A ton of internal changes. I have been improving the program structure internally. All changes were tested, but again, if you have any problems, please contact me.
You can get it at http://www.stgsys.com/fpp.asp, or just run the program, and use Menu Help, item Check for new version.
While I have completed surveys using SurveyMonkey for many years now, I had never used their system to make a survey, till last week.
I decided that there was too much I didn't know about STG FolderPrint Plus users, and that this got in the way of deciding on new features and products. So I used SurveyMonkey, with the MailChimp integration.
First of all, it was very easy to sign up for SurveyMonkey and get started. Their portuguese translation isn't very good, but thankfully I was able to change the language to english.
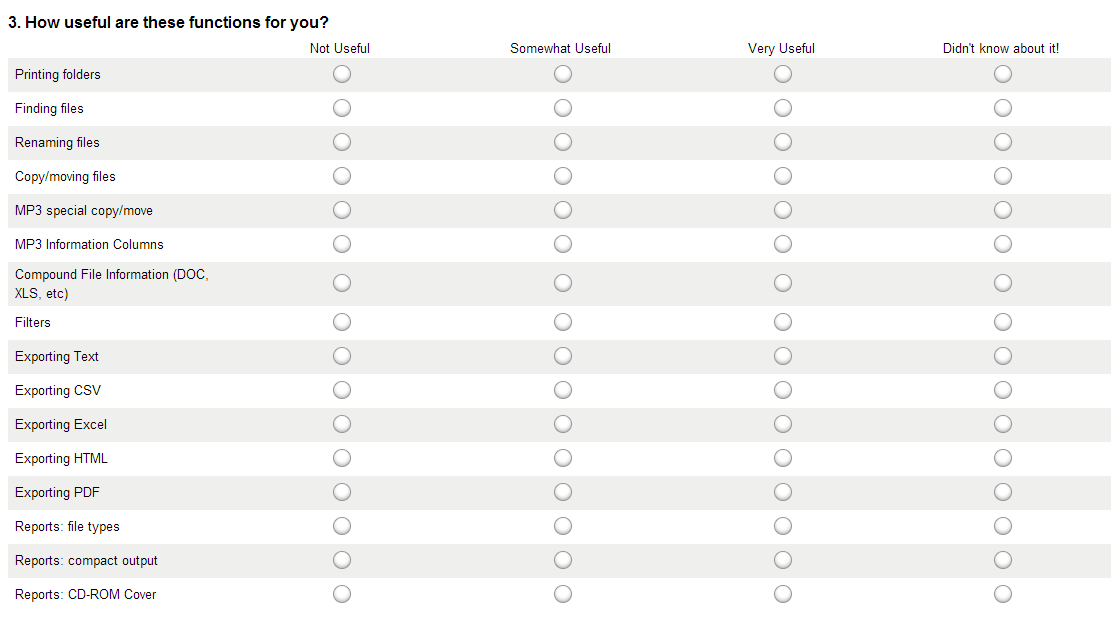
The free version has many limitations, but none is all that bad. You can only ask 10 questions, but more than that would be annoying anyway, and you can pack a lot of stuff into a single question matrix (see below).
Question Matrix
There is also a limit of 100 visible responses. I got less than that so far, and if I get more, I can just sign up for their basic service then.
There are also a ton of extras on other versions, but mostly aren't that interesting. Some that I miss is the ability to download the raw data and use filters and crosstabs. For example, I'd like to know what features business users want vs home users, but that is not possible with the free version (you can see each response, so I imagine you could spider or hand copy and paste each one…) .
Sending the survey was very easy using MailChimp (not related, despite the simian names). You just have to authorize with your SurveyMonkey account, and use a special template to get started. At this point you just pick the survey, and send to an existing list.
The nice part about the integration is the extra abilities that you get (otherwise you'd just do a normal campaign and send the survey link). You can see right at MailChimp which users answered your survey, and see their responses. You can also send follow-ups thanking them (and maybe sending them something extra), or requesting people that didn't take the survey to do so. I'm not going to do that though – seems quite annoying!
Overall, I liked SurveyMonkey. For free, it is a very good service, and I've gotten plenty of useful information from the survey, which I plan to share in a few posts later.
I've just finished reading Interactive Data Visualization for the Web (An Introduction to Designing with D3), by Scott Murray. This book covers the basics on how to use D3, a library to make it easier to do data visualizations (see the very cool gallery for an example of what has been done with it).
This is Early Release Version 3 of the book, so there may be changes in the finished release.
The book covers the basics on how to use D3 – starting with a bar chart all the way to how to convert shapefiles and display maps.
One thing I found interesting is how similar using D3 feels to JQuery. They very much are helper libraries. I expected D3 to be more of a delphi component – point it to the data, set a few parameters and it goes from there. But in reality, there will be a quite bit of code for anything you do. The advantage is that it is very, very flexible.
The style of the book is quite light, and it is targeted to all users who want to do data visualization – not just programmers. Thus, there is a quick introduction to a lot of basics, including the Web, HTML, DOM, CSS, Javascript and SVG. It seems feasible that a dedicated reader would be able to follow it without much programming experience.
Overall, I liked it. The examples all work and are useful, and it took me about 4 hours to read it, including trying out all examples and following some of the links to useful resources.
We use cookies to ensure that we give you the best experience on our website. If you continue to use this site we will assume that you are happy with it.Accept