I took the Data Analysis course, by Jeff Leek, on Coursera some time ago.
The course covers how to do data analysis. The useful parts if you are not a data analyst or planning on becoming one, is that you learn some statistics, how to explore data and see correlations, and also how to use R, which is an interesting language for statistics. It is also fairly easy to use for graphs, and you can achieve quite a lot with very little code.
The course is mostly in video, and you have a weekly quizzes as well as 2 data analyses that you have to make.
It took me about 23 hours to complete the course, including quizzes and data analyses.
Overall I found the course to be good, although I found some of the later quizzes to be a little hard. I think it could have used more practical exercises and quizzes, and some of the later classes could be more clear.
Recommended if you are interested in the area.
Don't have a lot of time? Some of what is covered here is also in Visualize This – and even if you end up taking the course, you will probably be able to use some of what you learned in the book.
The Art of SEO: Mastering Search Engine Optimization – is pretty good.
I'd say it probably cover most of what you need to know. It doesn't cover a few tools I'm fond of (but of course it wouldn't be possible to cover all of them).
Usually at this point I'd go through my notes and say what I liked about the book – but this where its main problem comes from – it is too long.
The authors seem to have a talent for extending text well beyond what you'd think possible, and they are clearly not fans of hyperlinking – many times things will be explained in one chapter and then be explained almost exactly the same from another angle in the next chapter (or even sections on the same chapter). While this do save the time of anyone who is looking at sections for a specific purpose, if you are reading the whole book through it is very tiresome.
That said, I do have a very large amount of highlights and notes on this book. It is good stuff, I just wish the authors could be a little (or lot) more succinct.
Mandrill is MailChimp's general e-mail sender. So if you have any web app, you can either just change the SMTP address or use their API and send through them. Why is Mandrill better? You get notifications of who opened and clicked what in those e-mails, with minimal work on your part. It can even notify your web apps. There is some impressive stuff, too – such as automatically modifying e-mails your system already send to change templates or add Google Analytics tracking.
With the new integration, you get a lot of extra possibilities. Whenever you send a new e-mail to your lists, you can just send to people who received, opened or clicked (or didn't) any other e-mails you sent through your app. And there are a ton of other filters – such as near a location, part of a social network or a specific e-mail client. For example, you can easily filter out or in people who bought a specific product from you (if you use a tag on your e-mail), and send a follow up cross sale. Or if they didn't, you could send a discount.
Pretty cool stuff, specially considering their very low prices – and the first 12000 e-mails are free!
MailChimp recently posted an interesting article about how they did their own e-mail marketing for a new app.
What I liked the most was the view on how they segment their list to maximize the impact of the e-mail they sent, while at the same time having minimal unsubscribes.
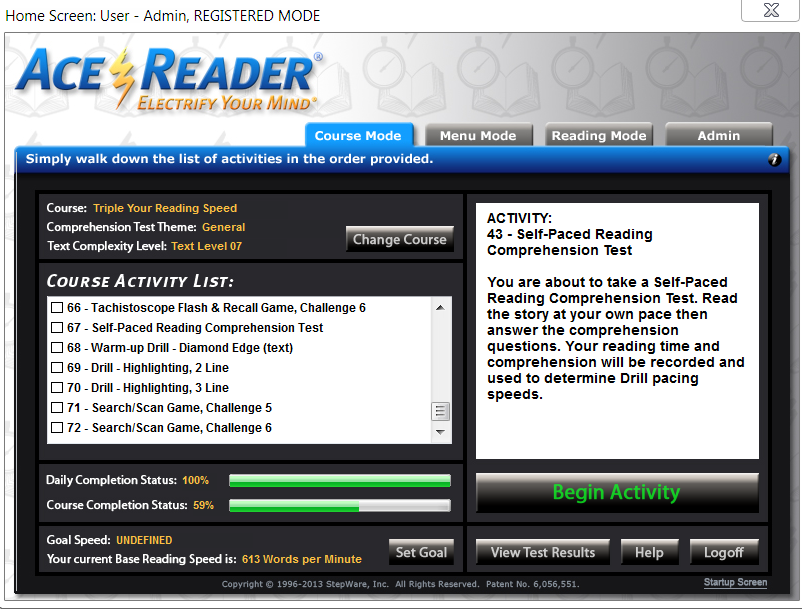
Ace Reader is a program designed to help speed up your reading. It has a series of tests and exercises designed to make you read faster.
These include:
– the basic tests, which measure your speed and recall. When you start a course you can also select the grade – from 1 to 13, corresponding to school grades. Newspapers are in 5th or 6th grade level according to the program.
– eye exercises, such as following objects around the screen, or focusing on the center of the screen while the numbers widen (to widen your focus).
– flashing lines one (or more) at a time (to help you read a whole line at once and avoid backtracking).
– texts in multiple columns with flashing highlights you should follow.
– games where you must quickly say if the words are the same, or pick them up from a selection later.
– games where you must search a list of names for a particular name (to help you find things in lists).
I think that their system works well. I always read pretty fast and I did do a regular speed reading course about 20 years ago, so I started at 381 Words/Min and Grade 3 (the default) – the program keeps logs. I don't know if the type of exercises changed with the speed, but I don't think so.
Two weeks later, with a bit less than 10 minutes practice per day, I usually test at 500-600 words for Grade 7 texts, and I feel the speed difference both when reading and also when scanning lists.
The only problem I have is that the program likes opening certain windows in Monitor 1, even if it is not the primary monitor. Unfortunately, this a known problem and support doesn't seem to plan to fix this. Obviously, this can only affect you if you have a multi-monitor system (in which monitor 1 is not the primary). I just drag the windows myself, for some of the exercises.
The program is expensive (about US$69 for the Pro version and US$99 for the Elite Version) – but it is often featured on Bits Du Jour (a software discount site), so if you wait you can get a nice discount. I got the Elite version at 50% off.
Overall, very much recommended if you would like to read faster.
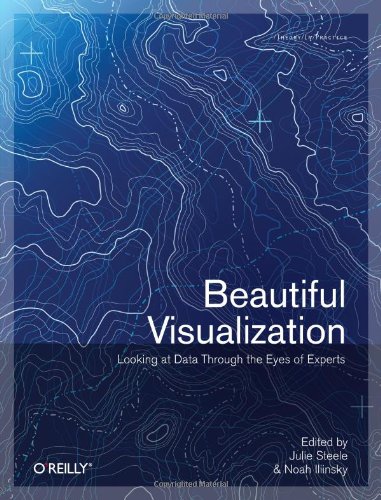
I have finished reading Beautiful Visualization a few weeks ago. It does have a lot interesting content, so I expect the review to take a while.
The book is composed of essays in visualization. Some are awesome – they are not only interesting, but can also teach a lot about the field. Others are just a waste of space. I'll comment on what I found interesting.
Chapter 1. On Beauty
Mostly generic, with an interesting section on the table of elements and some useful advice.
Chapter 2. Once Upon a Stacked Time Series
Useful advice on questions that can be answered with visualization and data sources, as well as an interesting practical data visualization.
Chapter 3. Wordle
Talks about Wordle, the word collage system, and some of the techniques that went into building it. Nice.
Chapter 4. Color: The Cinderella of Data Visualization
Lots of useful examples and very useful advice. Includes some R code.
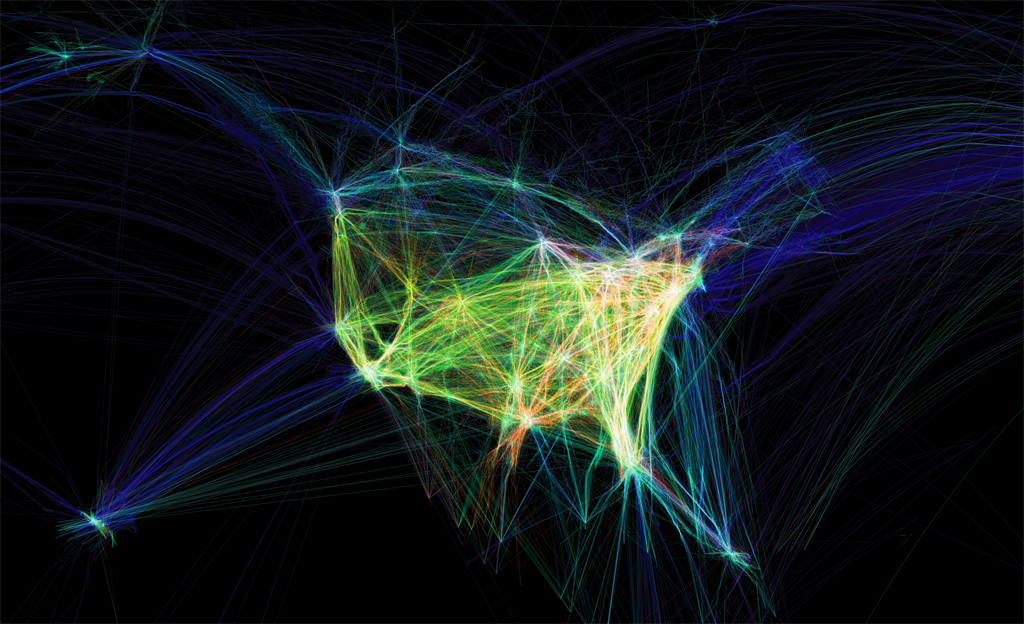
Chapter 6. Flight Patterns: A Deep Dive
Talks about Flight Patterns, a beautiful visualization of flight data.
Flight Patterns
Chapter 7. Your Choices Reveal Who You Are: Mining and Visualizing Social Patterns
Interesting view of social patterns – which I had no idea began in 1930. This leads to a cool visualization of book purchases on Amazon, for technical and political books. The way the book clusters interconnect shows quite a bit about the content.
Chapter 8. Visualizing the U.S Senate Social Graph (1991-2009)
Very good. Shows how the senate is divided between the parties using the votes as the links between senators. Lots of info on how it was built.
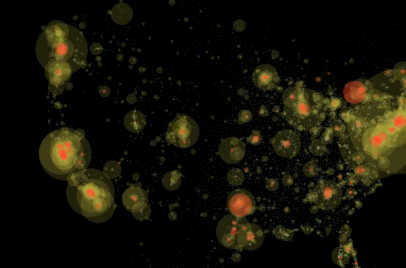
Chapter 9. The Big Picture: Search and Discovery
Graphics of queries for Yellow Page and the Netflix data set. Nice, with surprising conclusions and some insight on how to replicate.
Chapter 10. Finding Beautiful Insights in the Chaos of Social Network Visualizations
About SocialAction – a tool to generate social visualizations.
Chapter 11. Beautiful History: Visualizing Wikipedia
Several neat visualizations of Wikipedia edits.
Chapter 13. The Design of “X by Y”
A presentation of a visualization project of all entries to the Prix Ars Electronica. Some cool visualizations.
Chapter 15. This was 1994: Data Exploration with the NYTimes Article Search API
Nice view of the Times API – and some awesome visualization using the data.
Chapter 16. A Day in the Life of the New York Times
, and a great view into the process of creating it.
Chapter 19. Animation for Visualization: Opportunities and Drawbacks
A big view into various animation possibilities on visualization, and how well they work. Plenty of advice and examples.
Conclusion
Overall, I strongly recommend the book for anyone who is interested in visualization. There is plenty to see and learn in this book.
Note: Some people complained about the images in the PDF version being too small. I read the book on an iPad, using Kindle (Mobi format), and you can zoom into images by double-tapping them (you can them zoom and scroll). They looked fine.
I have just released version 4.02 of STG FolderPrint Plus.
Changes:
– Natural Sort – sorts files as 1,2,3,4,11 vs 1,11,2,3,4. User request on our recent survey.
– Scaled forms – if you use the standard Windows font size, you shouldn't notice any difference. However, if you use Large font size or larger, the program will try to scale most forms for the new font size. Personally, I use large fonts and I think it looks a lot better now! If you have any problems, please contact me.
– A ton of internal changes. I have been improving the program structure internally. All changes were tested, but again, if you have any problems, please contact me.
You can get it at http://www.stgsys.com/fpp.asp, or just run the program, and use Menu Help, item Check for new version.
While I have completed surveys using SurveyMonkey for many years now, I had never used their system to make a survey, till last week.
I decided that there was too much I didn't know about STG FolderPrint Plus users, and that this got in the way of deciding on new features and products. So I used SurveyMonkey, with the MailChimp integration.
First of all, it was very easy to sign up for SurveyMonkey and get started. Their portuguese translation isn't very good, but thankfully I was able to change the language to english.
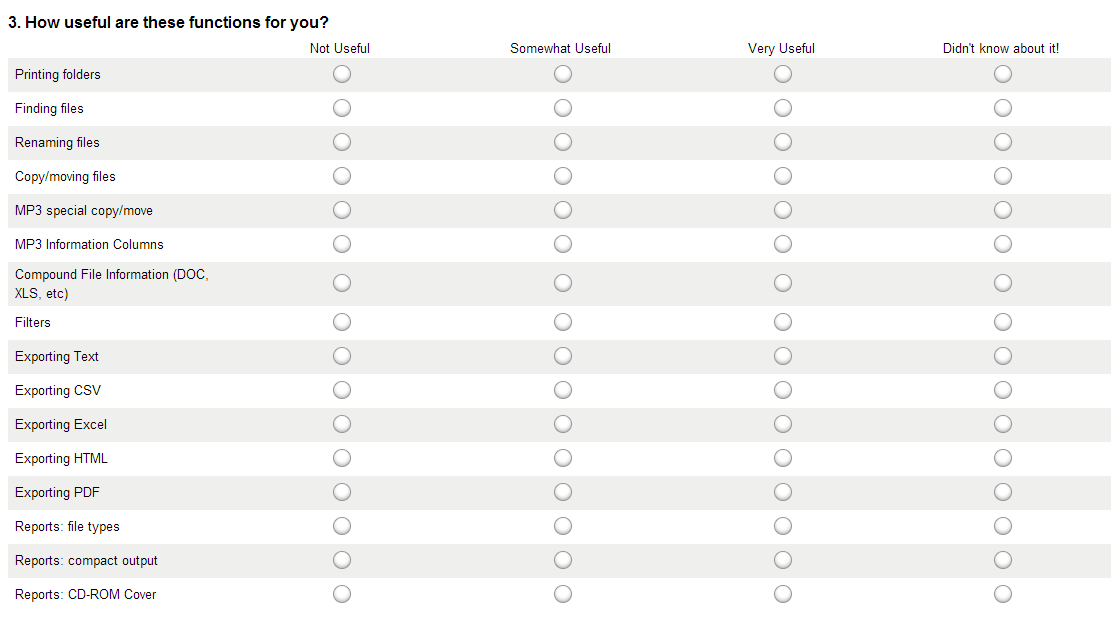
The free version has many limitations, but none is all that bad. You can only ask 10 questions, but more than that would be annoying anyway, and you can pack a lot of stuff into a single question matrix (see below).
Question Matrix
There is also a limit of 100 visible responses. I got less than that so far, and if I get more, I can just sign up for their basic service then.
There are also a ton of extras on other versions, but mostly aren't that interesting. Some that I miss is the ability to download the raw data and use filters and crosstabs. For example, I'd like to know what features business users want vs home users, but that is not possible with the free version (you can see each response, so I imagine you could spider or hand copy and paste each one…) .
Sending the survey was very easy using MailChimp (not related, despite the simian names). You just have to authorize with your SurveyMonkey account, and use a special template to get started. At this point you just pick the survey, and send to an existing list.
The nice part about the integration is the extra abilities that you get (otherwise you'd just do a normal campaign and send the survey link). You can see right at MailChimp which users answered your survey, and see their responses. You can also send follow-ups thanking them (and maybe sending them something extra), or requesting people that didn't take the survey to do so. I'm not going to do that though – seems quite annoying!
Overall, I liked SurveyMonkey. For free, it is a very good service, and I've gotten plenty of useful information from the survey, which I plan to share in a few posts later.
We use cookies to ensure that we give you the best experience on our website. If you continue to use this site we will assume that you are happy with it.Accept